Analysis

Worldcoin [WLD] price prediction – Here’s where buyers can look to go long
Posted:
Journalist
![Worldcoin [WLD] price prediction - Here's where buyers can look to go long](https://ambcrypto.com/wp-content/uploads/2025/05/Worldcoin-Featured-1200x675.webp)
- Worldcoin made quick work of the resistance zone at $1.4
- Surge could see the token overextended, making a pullback inevitable
Worldcoin’s [WLD] price registered a major 1-day candle on the charts, with the same rallying by 37% and counting for the day. In fact, the daily trading volume increased by nearly 140%, compared to the previous day.
The trend of WLD had been bullish over the past month, but this explosive move was not anticipated.
That’s not all though as Worldcoin Foundation raised $135 million on Wednesday for network expansion by selling its token to early investors. This saw WLD’s price climb, and the climb turned into a rocket launch.
Should WLD traders expect a short-term pullback?
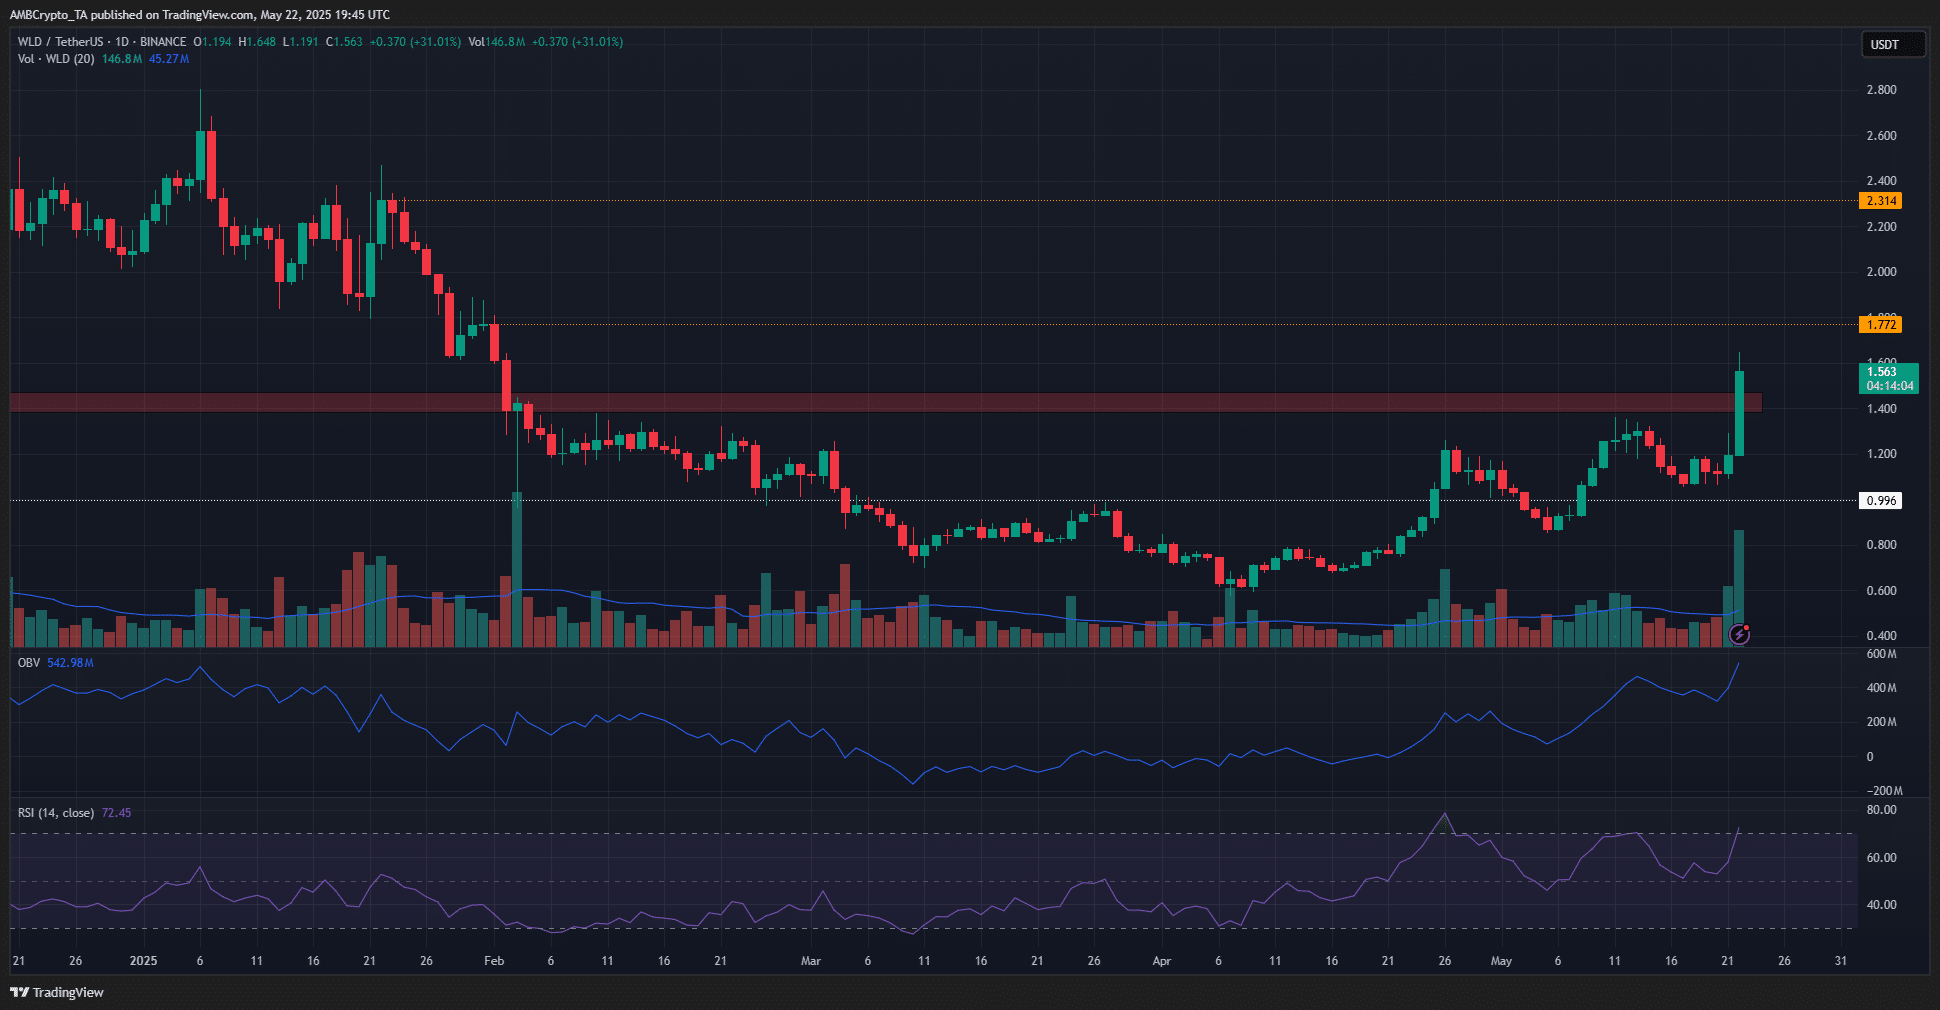
Source: WLD/USDT on TradingView
The 1-day chart revealed that an uptrend had already been in progress before the most recent 1-day candle burst out beyond $1.4. After the breach of the $1 psychological resistance (white) towards the end of April, the bullish intent was made clear.
Worldcoin dipped below $1 in early May, likely in a move to hunt liquidity, before reversing swiftly. A week ago, WLD’s price dipped to $1.07, once again retesting the demand zone around $1.
Throughout the past two months, the OBV has been trending higher. It made higher highs and higher lows and at press time, was pushing higher again. The RSI was at 72, the first foray into overbought territory in nearly two weeks. However, neither indicator highlighted a bearish divergence on this timeframe, and the rally could easily push towards $2 and beyond in the coming weeks.

Source: WLD/USDT on TradingView
The market does not move in a straight line upwards. The 4-hour chart appeared to be the exception to the rule. On the back of heavy demand over the past few days. Worldcoin rallied by 41% in under 36 hours.
While it was impressive, traders looking to go long should not FOMO now. They can wait for a pullback to $1.4, the long-term S/R level. A deeper dip to the previous local highs at $1.32 may also be possible.
Patience would be key for traders looking to re-enter a long trade. Meanwhile, traders already in long positions could book profits, especially if trading with leverage. Finally, at press time, the H4 RSI was at 87 – A high that has not been matched in recent weeks.
Disclaimer: The information presented does not constitute financial, investment, trading, or other types of advice and is solely the writer’s opinion


