THORChain jumps 16%, challenges $2.93 – Only THIS level stands in RUNE’s way

- RUNE’s rally may pause if the price fails to break above the $2.93 resistance zone.
- Diverging spot and derivatives activity point to a split market outlook and two-way price potential.
THORChain [RUNE] rallied 15.64% in the past 24 hours as bulls gain control of the market. However, it remains unclear whether the altcoin can maintain its 70% gain from the past month.
RUNE faces opposing trading activity between spot traders and retail participants, with a major hurdle ahead. Here’s what could happen next!
Major hurdle ahead for RUNE
Chart analysis shows that RUNE was approaching a critical level of resistance at press time. Resistance levels typically mark areas where selling orders cluster, currently around $2.93.
If RUNE reaches this level and selling momentum intensifies, it could decline to the $1.768 support level, which might trigger a rebound.
That said, if bullish momentum persists, a clean break above $2.93 could open the gates to a rally toward $4.14. This level marked the last major top before the February sell-off.
However, spot traders appear to be resisting the rally.
CoinGlass data revealed a Net Outflow of $1.68 million on the 22nd of May, indicating potential profit-taking or hedging behavior.
It is unclear whether this selling activity reflects short-term profit-taking or signals a longer correction. If it is the latter, RUNE faces further downside risk.
Can derivatives momentum hold the price?
Interestingly, the derivatives market tells a more optimistic story.
Key metrics such as Open Interest and the Long/Short Ratio have so far supported the potential for continued upside.
Open Interest, which tracks the total value of unsettled derivative contracts, surged by 18.65% in the past 24 hours to $86.57 million.
While this metric alone does not confirm a bullish or bearish trend, it reflects increased market activity.
Meanwhile, the Long/Short Ratio climbed to 1.105, suggesting that more traders are betting on further gains. This long-heavy bias could support prices—if spot selling doesn’t overwhelm it.
Can liquidity clusters offer clarity?
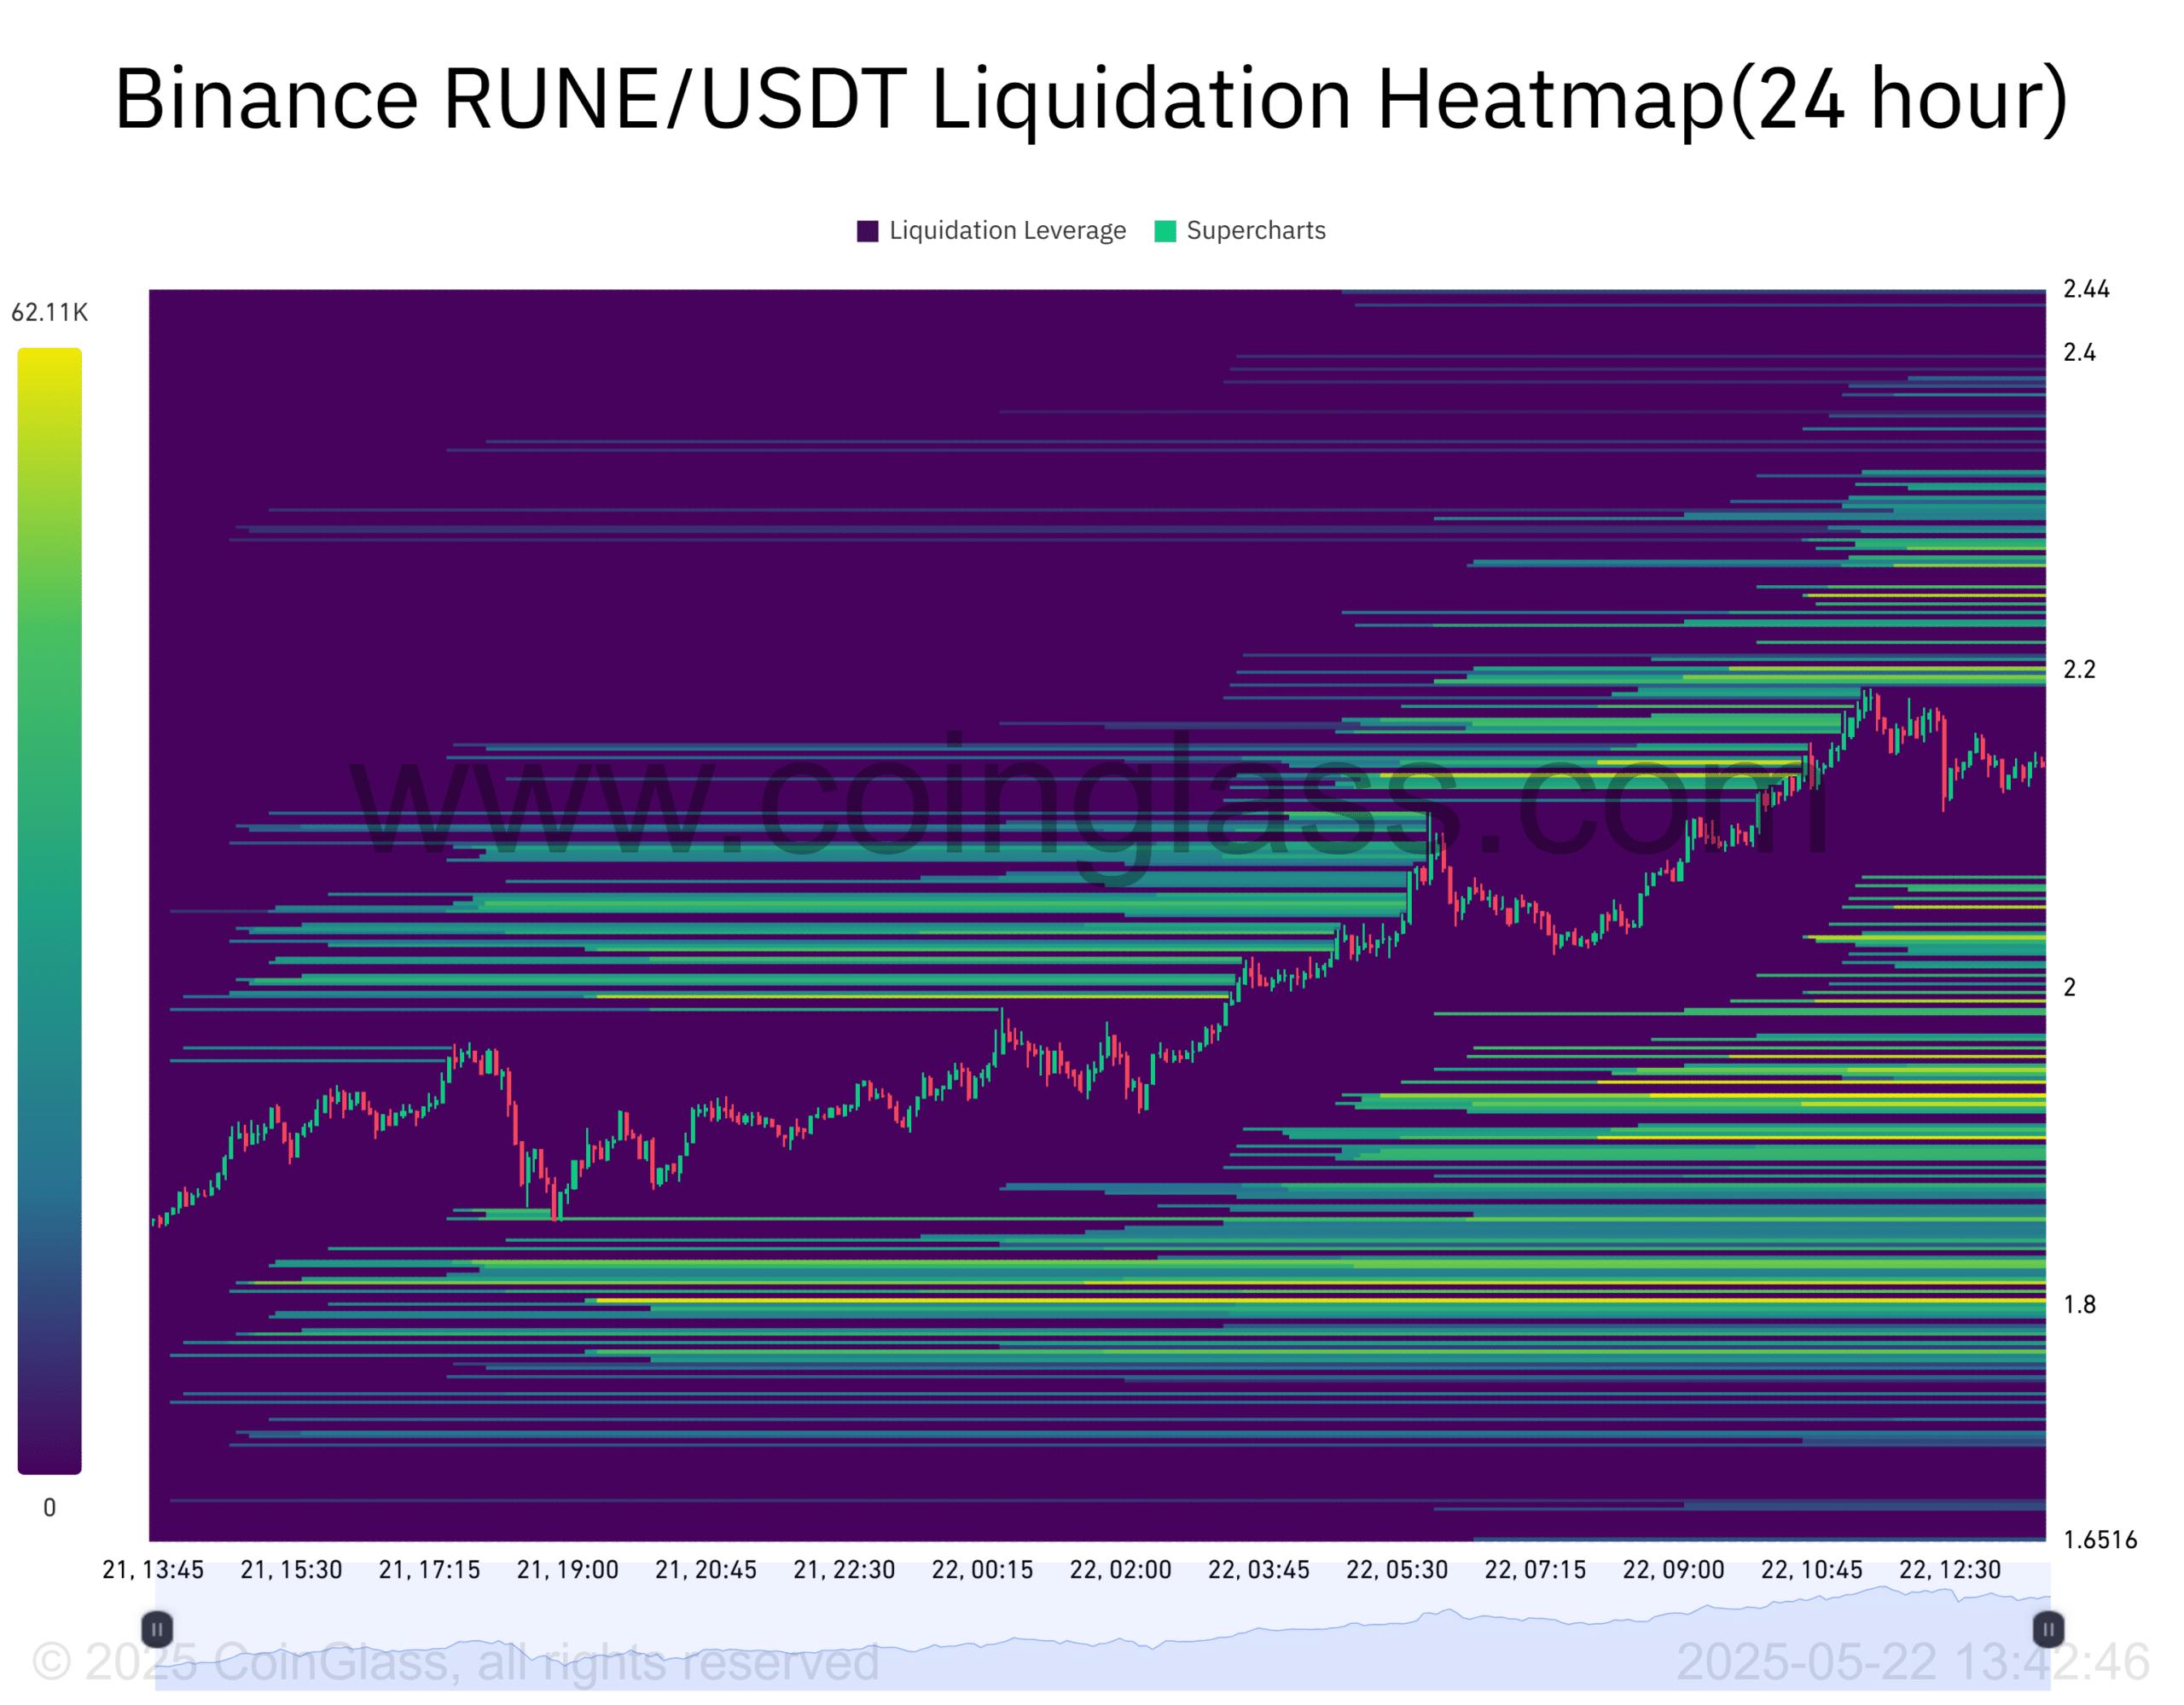
With conflicting signals from the spot and derivatives markets, AMBCrypto analyzed the Liquidation Heatmap for additional insight.
The heatmap highlights clusters of unsettled orders using various color zones (excluding black), which act as magnets that attract price movement.
More liquidity clusters appeared below the current price, especially near $1.70, indicating that a downward move could trigger liquidations and fuel a bounce.
If the price moves higher instead, RUNE will encounter a key resistance at approximately $2.30, which aligns with existing chart levels, before another possible decline.


